This data set was derived by Douglas and Delampady (1990) from the
Eastern Lakes Survey of 1984. It contains measurements of 1789
lakes in three Eastern US regions: Northeast, Upper Midwest and
Southeast. Of interest is the dependence of the water pH
level (![]() ) on the calcium concentration in
) on the calcium concentration in ![]() milligrams per liter (
milligrams per liter (![]() ) and the geographical location
(
) and the geographical location
(![]() where
where ![]() =latitude and
=latitude and ![]() =longitude).
Gu and Wahba (1993a) analyzed this data set using SS ANOVA
models. As in Gu and Wahba (1993a), we use a subset of 112
lakes in the southern Blue Ridge mountains area.
=longitude).
Gu and Wahba (1993a) analyzed this data set using SS ANOVA
models. As in Gu and Wahba (1993a), we use a subset of 112
lakes in the southern Blue Ridge mountains area.
We use this data set to illustrate how to fit a cubic spline, a cubic spline with correlated random errors, a SLM and an SS ANOVA model.
First, we fit a cubic spline to ![]() using one variable
calcium (
using one variable
calcium (![]() )
)
> acid.fit1 <- ssr(ph~t1, rk=cubic(t1), data=acid, scale=T)
> summary(acid.fit1)
...
GCV estimate(s) of smoothing parameter(s) : 3.84e-06
Equivalent Degrees of Freedom (DF):  8.21
Estimate of sigma:  0.281
> anova(acid.fit1)

Testing H_0: f in the NULL space

     test.value simu.size simu.p-value
LMP 0.003634651       100         0.04
GCV 0.008239078       100         0.02
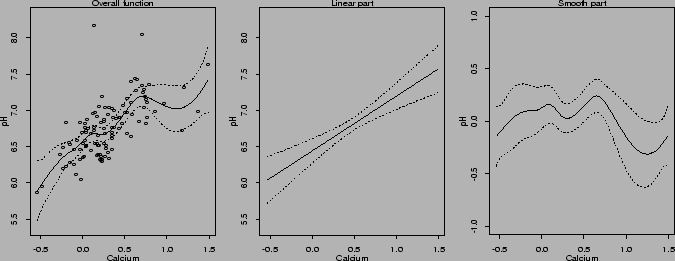
Both p-values from the LMP and GCV tests are small, indicating
that a simple linear model is not sufficient to describe the
relationship. This can be confirmed by looking at the
fitted function and its projections onto
![]() and
and ![]() . A linear model is
equivalent to the projection onto
. A linear model is
equivalent to the projection onto ![]() being zero.
The following statements compute posterior means and
standard deviations for the projections onto
being zero.
The following statements compute posterior means and
standard deviations for the projections onto ![]() with terms=c(1,1,0), the projections onto
with terms=c(1,1,0), the projections onto ![]() with terms=c(0,0,1), and the overall fit with
terms=c(1,1,1).
with terms=c(0,0,1), and the overall fit with
terms=c(1,1,1).
> grid <- data.frame(t1=seq(min(acid$t1), max(acid$t1), len=100))
> tm <- matrix(c(1,1,0,0,0,1,1,1,1), ncol=3, byrow=T)
> p.acid.fit1 <- predict(acid.fit1, grid, terms=tm)
Figure ![]() shows the fitted function and its projections.
The nonlinear part is small, but different from zero.
shows the fitted function and its projections.
The nonlinear part is small, but different from zero.
 |
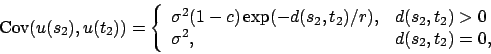
pH observations close in geographic locations are often
correlated. Suppose that we want to use spherical spatial correlation
structure with nugget effect for the variable
location
![]() . That is, regard random errors
. That is, regard random errors
![]() as a function of
as a function of ![]() , and assume
, and assume

> acid$s1 <- (acid$t1-min(acid$t1))/diff(range(acid$t1))
> acid.fit2 <- ssr(ph~s1, rk=cubic(s1), data=acid,
                   corr=corSpher(form=~x1+x2,nugget=T), spar="m")
> acid.fit2
...
Coefficients (d):
(Intercept)          s1
   6.221757    1.264431

GML estimate(s) of smoothing parameter(s) : 4.645508
Equivalent Degrees of Freedom (DF):  2.000284
Estimate of sigma:  0.2994075
Correlation structure of class corSpher representing
     range     nugget
0.03646616 0.68530949
We plot in Figure ![]() fitted curves from acid.fit1,
acid.fit2 and acid.fit5. Notice the effect of
the correlation on the smoothing parameter and the fit.
Equivalent degrees of freedom for
fitted curves from acid.fit1,
acid.fit2 and acid.fit5. Notice the effect of
the correlation on the smoothing parameter and the fit.
Equivalent degrees of freedom for ![]() decreased from 8.21 to 2.00.
The new fit is linear. The smaller smoothing parameter
in the first fit might be caused by the spatial correlation.
decreased from 8.21 to 2.00.
The new fit is linear. The smaller smoothing parameter
in the first fit might be caused by the spatial correlation.
We can also model the effect of location directly as a covariate. We consider two approaches to model location effect: use random effects with exponential spatial correlation structure (similar to Kriging), and use thin plate splines.
For the first approach, we consider
Denote
![]() as the vector of design points for
as the vector of design points for ![]() . Let
. Let
![]() be the vector of the
be the vector of the ![]() process evaluated at
design points.
process evaluated at
design points.
![]() are random effects and
are random effects and
![]() ,
where
,
where ![]() depends parameters
depends parameters ![]() and
and ![]() .
Again, the SLM model (
.
Again, the SLM model (![]() ) cannot be
fitted directly using slm since
) cannot be
fitted directly using slm since ![]() depends on the
range parameter
depends on the
range parameter ![]() nonlinearly. We fit model (
nonlinearly. We fit model (![]() )
in two steps. We first regard
)
in two steps. We first regard
![]() as part of random error,
estimate the range parameter, and calculate the estimated
covariance matrix without nugget effect:
as part of random error,
estimate the range parameter, and calculate the estimated
covariance matrix without nugget effect:
> temp <- ssr(ph~t1+x1+x2, rk=tp(t1), data=acid,
              corr=corExp(form=~x1+x2, nugget=T), spar="m")
> tau <- coef(temp$cor.est, F)
> D <- corMatrix(initialize(corExp(tau[1],form=~x1+x2), data=acid))
Consider the estimated ![]() as the true covariance
matrix. Then we can calculate the Cholesky decomposition
of
as the true covariance
matrix. Then we can calculate the Cholesky decomposition
of ![]() as
as ![]() , and transform the random
effects
, and transform the random
effects
![]() , where
, where
![]() .
Now we are ready to fit the transformed SLM:
.
Now we are ready to fit the transformed SLM:
> Z <- chol.new(D)
> acid.fit3 <- slm(ph~t1+x1+x2, rk=tp(t1), data=acid,
                   random=list(pdIdent(~Z-1)))
> summary(acid.fit3)
...
Coefficients (d):
(Intercept)          t1          x1          x2
  6.5483884   0.6795706  -8.3694493   2.1135023

GML estimate(s) of smoothing parameter(s) : 0.0005272899
Equivalent Degrees of Freedom (DF):  4.000179
Estimate of sigma:  0.002725062
We then calculate the estimated effect of calcium:
grid1 <- data.frame(t1=seq(min(acid$t1), max(acid$t1), len=100),
                    x1=min(acid$x1), x2=min(acid$x2))
p.acid.fit3.t1 <- intervals(acid.fit3, grid1, terms=c(0,1,0,0,1))
Suppose that we want to calculate the location effect on
grid points
![]() . Let
. Let
![]() be the vector of the
be the vector of the ![]() process evaluated at elements in
process evaluated at elements in
![]() . Let
. Let
![]() . Then
. Then
![]() .
.
grid2 <- expand.grid(
                x1=seq(min(acid$x1)-.001,max(acid$x1)+.001, len=20),
                x2=seq(min(acid$x2)-.001,max(acid$x2)+.001, len=20))
newdata <- data.frame(y1=c(acid$x1,grid2$x1), y2=c(acid$x2,grid2$x2))
RD <- corMatrix(initialize(corExp(tau[1], form=~y1+y2), data=newdata))
R <- RD[(length(acid$x1)+1):length(newdata$y1),1:length(acid$x1)]
u.new <- R%*%t(solve(Z))%*%as.vector(acid.fit3$lme.obj$coef$random[[2]])
p.acid.fit3.t2 <- acid.fit3$lme.obj$coef$fixed[3]*grid2$x1+
                  acid.fit3$lme.obj$coef$fixed[4]*grid2$x2+u.new
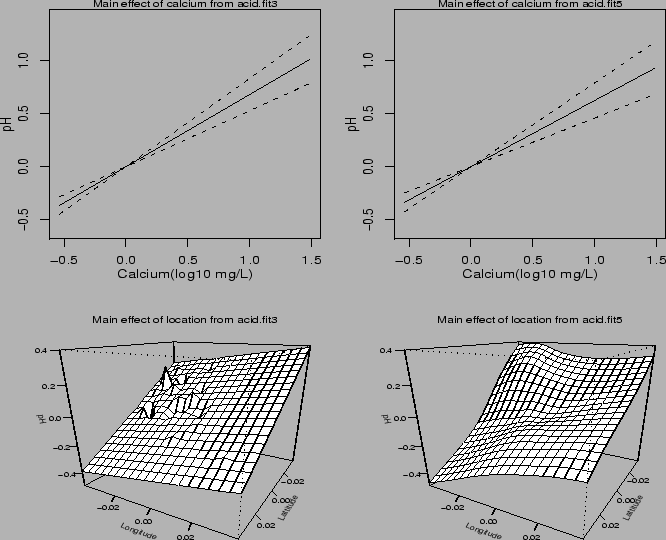
Figure ![]() plots the estimated main effects of
plots the estimated main effects of ![]() and
and
![]() on the left panel.
on the left panel.
As the second approach, we consider the same thin plate spline
model as in Gu and Wahba (1993a). Specifically,
we use a TPS with ![]() and
and ![]() to model
the effect of calcium, and a TPS with
to model
the effect of calcium, and a TPS with ![]() and
and ![]() to model
the effect of location. Then we have the following
SS ANOVA model
to model
the effect of location. Then we have the following
SS ANOVA model
> acid.fit4 <- ssr(ph~t1+x1+x2, rk=list(tp(t1), tp(list(x1,x2)),
                rk.prod(kron(t1),tp(list(x1,x2))), rk.prod(kron(x1),tp(t1)),
                rk.prod(kron(x2),tp(t1)), rk.prod(tp(t1),tp(list(x1,x2)))),
                data=acid, spar="m")
> summary(acid.fit4)
...
Coefficients (d):
 (Intercept)        t1        x1       x2
    6.555506 0.6235892 -8.783944 1.974596

GML estimate(s) of smoothing parameter(s) : 1.816737e+04
3.600865e-03 2.710276e+01 2.759507e+00 1.992876e+01 1.440841e-01
Equivalent Degrees of Freedom (DF):  10.7211
Estimate of sigma:  0.2560693
Since the smoothing parameters corresponding to the interaction terms are large, it is easy to check that these interaction terms are small. Thus we reduce to the following additive model with main effects only
> acid.fit5 <- update(acid.fit3,  rk=list(tp(t1), tp(list(x1,x2))))
> summary(acid.fit5)
... ...
Coefficients (d):
 (Intercept)        t1        x1       x2
    6.555502 0.6235885 -8.783569 1.974339

GML estimate(s) of smoothing parameter(s) : 6.045750e+03 3.600423e-03
Equivalent Degrees of Freedom (DF):  10.72108
Estimate of sigma:  0.2560684
> grid3 <- data.frame(t1=seq(min(acid$t1), max(acid$t1), len=100),
                      x1=min(acid$x1), x2=min(acid$x2))
> p.acid.fit5.t1 <- predict(acid.fit5, grid3, terms=c(0,1,0,0,1,0))
> grid4 <- expand.grid(t1=min(acid$t1),
                       x1=seq(min(acid$x1), max(acid$x1), len=20),
                       x2=seq(min(acid$x2), max(acid$x2), len=20))
> p.acid.fit5.t2 <- predict(acid.fit5, grid4, terms=c(0,0,1,1,0,1))
Figure ![]() plots the estimated main effects of
plots the estimated main effects of ![]() and
and
![]() on the right panel. It is seen that the estimates
of the calcium main effects are almost identical. The estimates
of the location main effects have a similar pattern. The estimate
from acid.fit5 is smoother.
on the right panel. It is seen that the estimates
of the calcium main effects are almost identical. The estimates
of the location main effects have a similar pattern. The estimate
from acid.fit5 is smoother.
> grid3 <- data.frame(t1=seq(min(acid$t1), max(acid$t1), len=100),
                      x1=min(acid$x1), x2=min(acid$x2))
> p.acid.fit5.t1 <- predict(acid.fit5, grid3, terms=c(0,1,0,0,1,0))
> grid4 <- expand.grid(t1=min(acid$t1),
                       x1=seq(min(acid$x1), max(acid$x1), len=20),
                       x2=seq(min(acid$x2), max(acid$x2), len=20))
> p.acid.fit5.t2 <- predict(acid.fit5, grid4, terms=c(0,0,1,1,0,1))
 |
